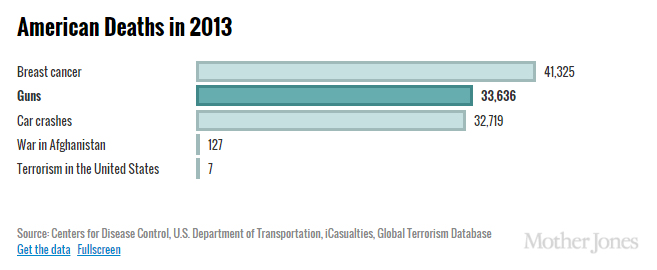
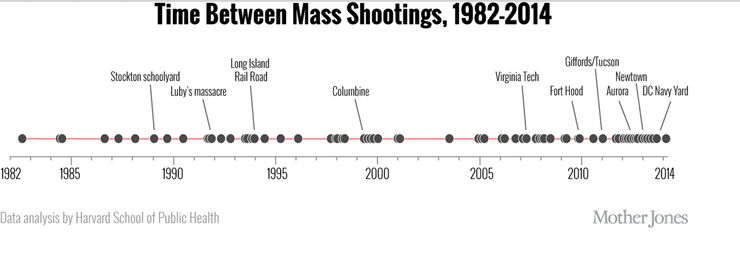
In the wake of yet another mass shooting, the President challenged the press to research and compare gun violence data from the last 10 years: “Tally up the number of Americans who’ve been killed through terrorist attacks over the last decade and the number of Americans who’ve been killed by gun violence and post those side by side on your news reports.”
We’ve added a small selection of the results from the President’s challenge to our Stats & Charts page, but the number of compelling visualizations and the data collected on several levels is chilling. See more of the roundup below…
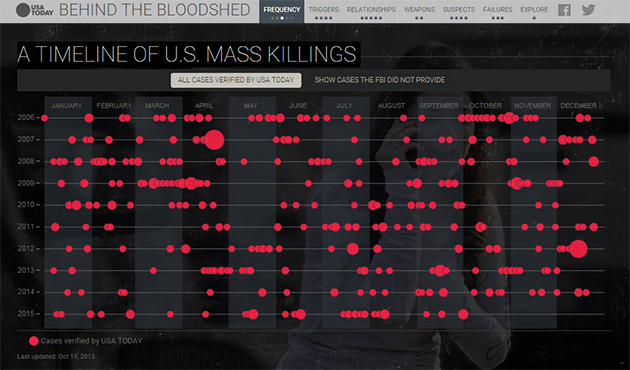
USA Today: Behind the Bloodshed – A Timeline of US Mass Killings | Source
“The untold story of America’s Mass Killings” USA Today
Explore the interactive resource here »
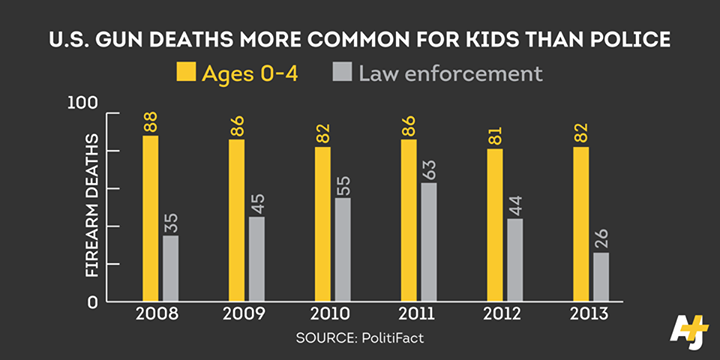
AJ+: US Gun Deaths More Common for Kids than Police | Source
“In America, it’s more dangerous to be a little kid than a cop.” AJ+
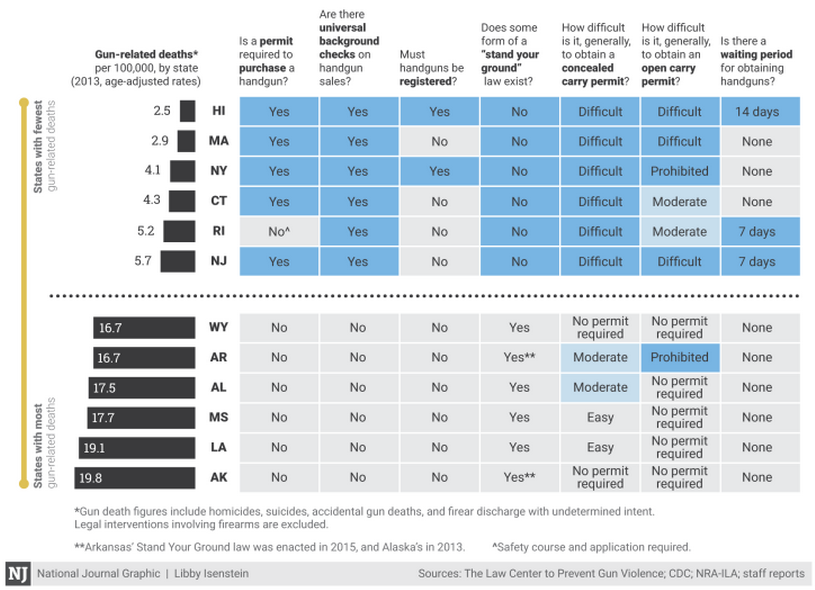
National Journal: Gun-Related Legislation Data Charts | Source
“The States With The Most Gun Laws See The Fewest Gun-Related Deaths…
But there’s still little appetite to talk about more restrictions.” Libby Isenstein
View full chart of all states here
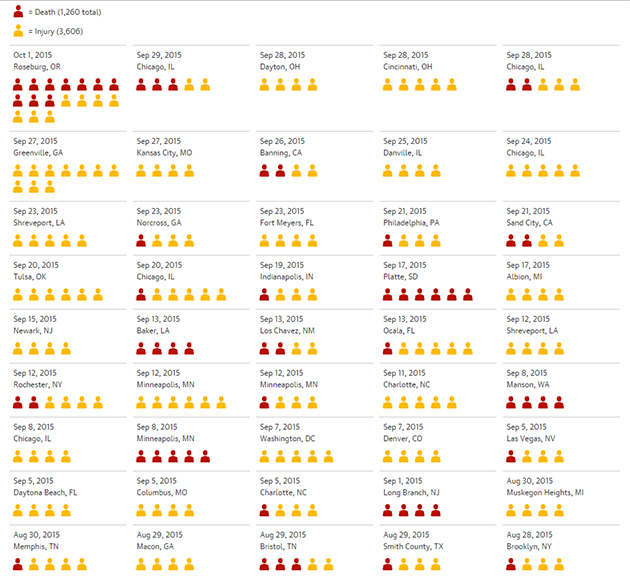
The Guardian: 994 mass shootings in 1,004 days | Source
“The data compiled by the crowd-sourced site Mass Shooting Tracker reveals an even more shocking human toll: there is a mass shooting – defined as four or more people shot in one incident – nearly every day.” Guardian US Interactive Team
Mother Jones: American Deaths in 2013 | Source 1, Source 2
“The numbers come from 2013—the most recent year that data is available from the Centers for Disease Control and Prevention.” Julia Lurie
“New research from Harvard shows a chilling rise in public mass shootings—and debunks a popular claim that they haven’t increased.” Mark Follman
To see more statistical data on gun-related crime in the US, visit our Stats & Charts.
